max planck institut
informatik
informatik

Results are stored for two days and then are deleted automatically. They are accessible from the link on top of the results
page. It is also possible to download the results as tab-delimited text file or to print them. The print view contains
no markup code. Results can be interactively explored using Mondrian or Medusa (more information can be found here.
There are five drop-down boxes arranged in three lines. The first four boxes allow for hiding and showing
columns of the results table either individually, e.g. the column BP simRel, or in groups, e.g. all BP columns. The last drop-down
box allows for selecting a color gradient. It is required to have JavaScript enabled to hide/show
columns, or to change the coloring scheme. Hiding columns and changing the color gradient does not affect the download
and print options.
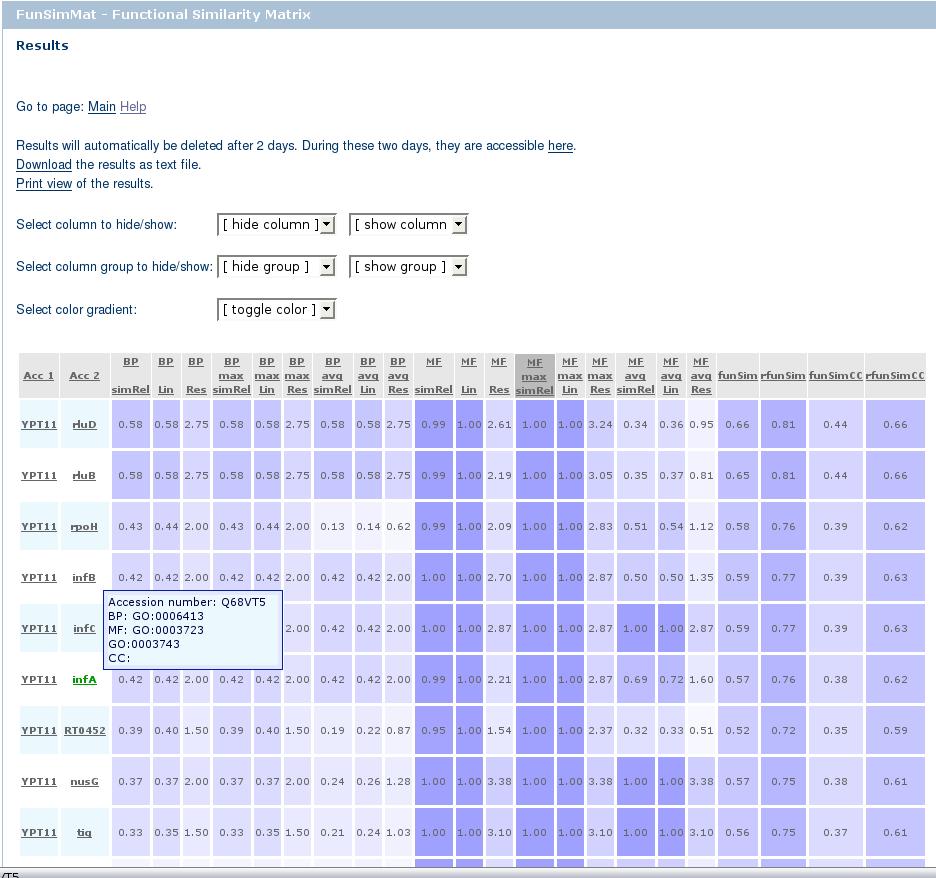
The table consists of two parts: the header and the body. Clicking on one column of the header sorts the table according
to this column. The first click sorts the table in descending order, and the second click on the same column in ascending order.
The header of the sorted column is marked with a darker background color. The performed sorting also affects the download and print
options, i.e. the downloaded file is sorted according to the last selected column. There is a "?" that links to the help section
describing a score besides the name of the column. Hovering over one of the columns in the table header shows a tooltip with a short
description of the score in this column.
The first two columns contain the identifiers. These can be either UniProt for protein, Pfam or SMART for protein families,
Gene Ontology for functional terms, or annotation classes. An annotation class is a specific combination of GO terms from
one ontology, e.g. GO:0000001 and GO:0000002 form a biological process annotation class. Clicking on annotation classes
opens a new window containing all proteins and protein families belonging to this class, i.e. annotated with that specific
combination of GO terms. The annotation class id is unique. The definition of annotation classes and the mapping of proteins
and protein families to the annotation classes can be downloaded here. If an annotation class is 0, no protein or protein family
in the database is annotated with exactly this combination of GO terms entered. All other identifiers are linked to their source database.
The other columns contain the computed similarity scores. The score fields are colored according to a gradient that goes from white to blue,
red, or green. White represents 0, the minimum value for all scores. The maximum of all scores except Res scores
is 1. In case of Res scores, there is no explicit maximum. For more information on the scores, please see this page.
Hovering over one of the score entries with the mouse will show a tooltip with the category of the score, i.e. whether it is
biological process (BP), molecular function (MF), cellular component (CC), or funSim score.