max planck institut
informatik
informatik

Resnik's measure is a measure of semantic similarity between ontology terms. It is based on the information content of a term,
which uses the term probability. We define the relative frequency of a GO term in the UniProt database as its probability.
Resnik's measure for comparing two terms t1 and t2 is defined as follows:
![]()
S(t1, t2) is the set of common ancestors of terms t1 and t2 in the ontology. It ranges from 0 for terms without similarity to infinity.
We use the abbreviation Res for referring to Resnik's measure. By default, these columns are hidden in the results of functional
comparison.
Ref.: Resnik, J Artif Intell Res (1999), 11:95-130.
Lin's measure of semantic similarity is also based on the information content of GO terms. Lin's measure for comparing two terms
t1 and t2 is defined as follows:
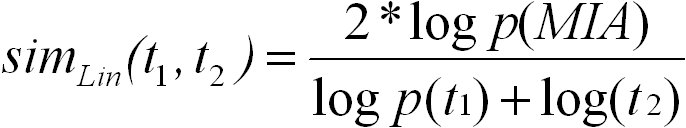
Again, S(t1, t2) is the set of common ancestors of terms t1 and t2 in the ontology. Lin's measure ranges from 0 for terms without
similarity to 1 for terms with maximum similarity. We use the abbreviation Lin for referring to Lin's measure.
Ref.: Lin, Proc 15th Int'l Conf. on Machine Learning (ICML-98) (1998), 296-304.
The simRel score is a functional similarity measure for comparing two GO terms with each other. It is based on Resnik's and Lin's
similarity measures. The simRel score ranges from 0 for terms that have no similarity to 1 for terms with maximum similarity. It is
calculated as follows:
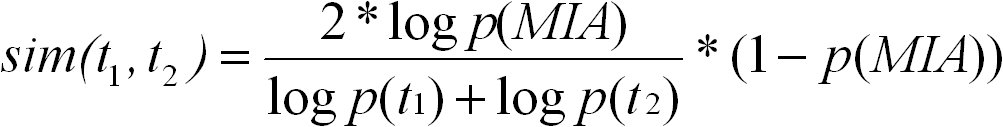
t1 and t2 are two GO terms, and S(t1, t2) is the set of their common ancestors in the ontology. simRel ranges from 0 for terms without
similarity to 1 for terms with maximum similarity. We use the abbreviation simRel for referring to the simRel score.
Ref.: Schlicker et al., BMC Bioinformatics (2006), 7(1):302
Jiang and Conrath defined a distance measure between GO terms that is based on the information content. The similarity measure
using Jiang and Conrath's distance is defined as follows:
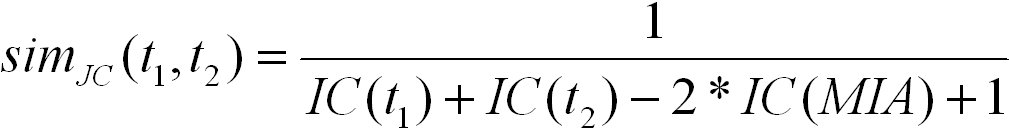
S(t1, t2) is the set of common ancestors of terms t1 and t2 in the ontology. It ranges from 0 for terms without similarity to 1.
We use the abbreviation Jiang for referring to this score. By default, these columns are hidden in the results of functional
comparison.
Ref.: Couto et al., Data & Knowledge Engineering (2007), 137-152
Functional similarity measures are used to compare two proteins or protein families. There are two types of functional similarity
measures, structure-based and semantic similarity-based. The different functional similarity measures between two proteins
or protein families p and q annotated with the sets GOp and GOq of sizes N and M, respectively, are defined as follows.
The UI score is defined as follows:
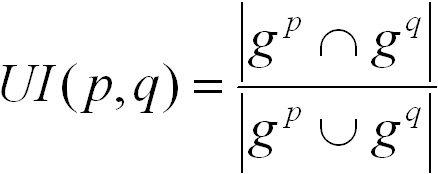
gp and gq are the nodes in graphs induced by the sets GOp and GOq, respectively. The graph induced by a term t
contains t and all of its ancestor terms. The UI score ranges from 0 for no similarity to 1 for highest similarity.
By default, these columns are hidden in the results of functional comparison.
Ref.: Guo et al., Bioinformatics (2006), 967-973
The simGIC score is based on the UI score. Instead of counting the number of nodes in the union and intersection of the two induced
graphs, it sums up their information content. It is defined as follows:
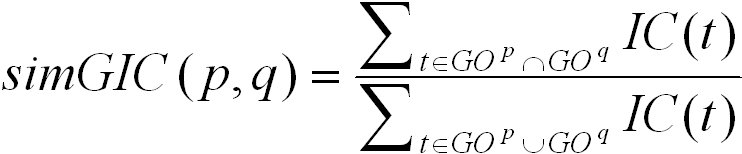
The simGIC score ranges from 0 for no similarity to 1 for highest similarity. By default, these columns are hidden in the
results of functional comparison.
Ref.: Pesquita et al., Proc 10th Annual Bio-Ontologies Meeting (2007)
The term overlap (TO) and normalized term overlap (NTO) scores are based on the number of annotated terms shared between two proteins.
The TO score is defined as the number of terms shared between gp and gq, but excluding the root terms:
![]()
The NTO score is defined as the TO score normalized by the number of terms in the smaller graphs:
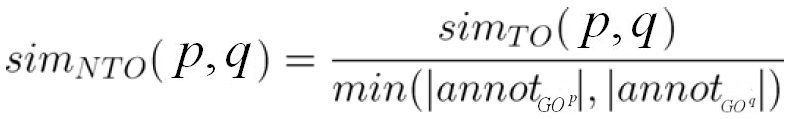
Ref.: Mistry and Pavlidis, BMC Bioinformatics (2008), 9:327
A GOscore is a measure of functional similarity between two proteins or protein families with respect to either biological process
(BPscore), molecular function (MFscore), or cellular component (CCscore). Considering two gene products A and B annotated
with the sets GOA and GOB of GO terms with sizes N and M, respectively, a similarity matrix S is calculated. This matrix contains
all pair wise similarity values of mappings GOAi of gene product A and mappings GOBj of gene product B:
![]()
The matrix S is not necessarily symmetric or square since the proteins can have different types and numbers of GO mappings. The
rows and the columns of S represent two different directional comparisons, row vectors correspond to a comparison of A to B
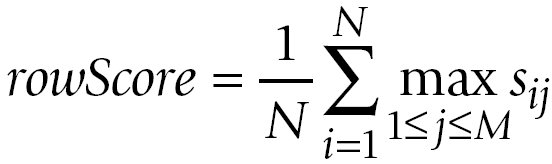
and column vectors to a comparison of B to A. The best hits for the comparison of A with B are determined as maximum values in the
rows in matrix S (row maxima). The maximum values in the columns of S (column maxima) are the best hits for the direction B to A.
The averages over the row maxima and the column maxima give similarity values for the comparison of A to B and the comparison of
B to A, respectively:
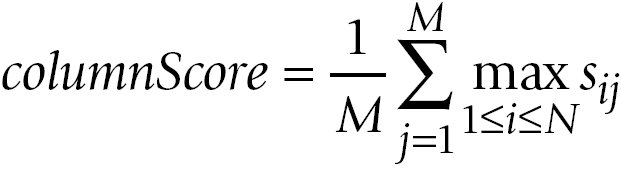
The GOscore is then computed as the maximum of rowScore and columnScore:
![]()
It can be computed either by Resnik's measure, Lin's measure or simRel. We use the abbreviations BP, MF, and CC for referring to
the BPscore, MFscore, and CCscore, respectively.
Ref.: Schlicker et al., BMC Bioinformatics (2006), 7(1):302
GOscore max is a measure of functional similarity between two proteins or protein families with respect to either biological process
(BPscore), molecular function (MFscore), or cellular component (CCscore). The matrix S is computed as described for GOscore BM.
GOscore max is defined as the maximum over all sij:
![]()
It can be computed either by Resnik's measure, Lin's measure or simRel.
Ref.: Lord et al., Bioinformatics (2003), 19(10):1275-1283
GOscore avg is a measure of functional similarity between two proteins or protein families with respect to either biological process (BPscore),
molecular function (MFscore), or cellular component (CCscore). The matrix S is computed as described for GOscore BM.
GOscore max is defined as the maximum over all sij:
![]()
It can be computed either by Resnik's measure, Lin's measure or simRel.
Ref.: Lord et al., Bioinformatics (2003), 19(10):1275-1283
The funSim score is calculated from the BPscore and the MFscore of a pair of proteins or protein families. It is defined as follows:
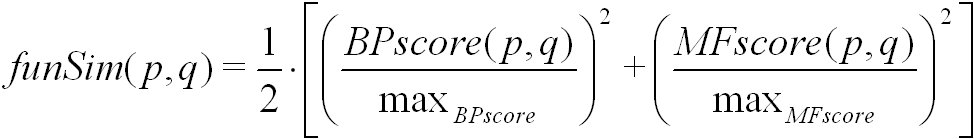
Here, max(BPscore) and max(MFscore) denote the maximal score for biological process and molecular function, respectively.
The funSim score is computed using simRel, and GOscore. It ranges from 0 for no functional similarity to 1 for maximal functional similarity.
Ref.: Schlicker et al., BMC Bioinformatics (2006), 7(1):302
The rfunSim score is calculated from the funSim of a pair of proteins or protein families. It is defined as square root of the funSim score. It
ranges from 0 for no functional similarity to 1 for maximal functional similarity.
Ref.: Schlicker et al., Genome Biol (2007), 8(3):R33
The funSimAll score is calculated from the BPscore, MFscore and the CCscore of a pair of proteins or protein families. It is defined as:
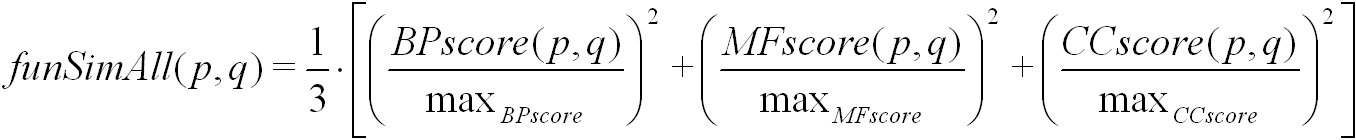
Here, max(BPscore), max(MFscore) and max(CCscore) denote the maximum possible score for biological process, molecular function, and
cellular component, respectively. The funSim score is computed using simRel, and GOscore. It ranges from 0 for no functional similarity to 1
for maximal functional similarity.
The rfunSimAll score is calculated as the square root of the funSimAll score of a pair of proteins or protein families.
It ranges from 0 for no functional similarity to 1 for maximal functional similarity.